
Harden’s Hot Streak Fuels Clippers’ Playoff push
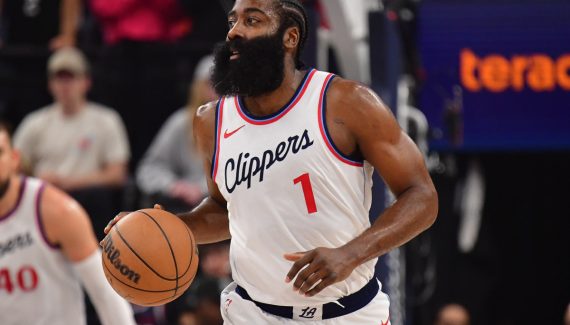
LOS ANGELES (AP) — After a post-All-Star break slump, James Harden has ignited the Los Angeles Clippers, spearheading a three-game winning streak as they battle for playoff positioning in the Western Conference.
Harden’s Explosive Performance Resurrects Clippers’ Momentum
Harden’s resurgence couldn’t have come at a better time for the Clippers, who struggled with six losses in seven games following the All-Star break. A series of injuries to key players compounded their woes. Tho, Harden’s return to form has steadied the ship, highlighted by a dominant 50-point performance against the Detroit Pistons, where he shot 14-for-24 from the field, including 6-for-13 from beyond the arc, and a stellar 16-for-20 from the free-throw line.
‘I’ll Rest When the Season is Over’: Harden Embraces Heavy Workload
Clippers coach Tyronn Lue praised Harden’s resilience, noting his ability to score 50 points at 35 years old speaks volumes about his character. Harden himself seems unfazed by the heavy minutes, stating, “I’ll rest when the season is over,” following his 50-point game.
Harden’s All-Around Excellence Propels Clippers forward
Harden continued his stellar play with 27 points and 7 assists in a victory against the New york Knicks, followed by a near triple-double performance of 29 points, 11 assists, and 9 rebounds in a win against the Sacramento Kings.While Kawhi Leonard’s game-winning shot against the kings grabbed headlines,it was Harden who kept the Clippers competitive throughout the game.
Clippers Face Favorable Road Ahead in Playoff Quest
Over the last three games, Harden has averaged an impressive 35.3 points on 49% shooting from the field and 39% from three-point range. As the regular season nears its end, the Clippers embark on a road trip with matchups against the New Orleans Pelicans, miami Heat, Atlanta Hawks, and Charlotte Hornets.
James Harden’s NBA Statistics
| James Harden | Pourcentage | Rebonds | |||||||||||||
|---|---|---|---|---|---|---|---|---|---|---|---|---|---|---|---|
| Saison | Equipe | MJ | Min | Tirs | 3pts | LF | Off | Def | Tot | Pd | Fte | Int | Bp | Ct | pts |
| 2009-10 | OKC | 76 | 23 | 40.3 | 37.5 | 80.8 | 0.6 | 2.6 | 3.2 | 1.8 | 2.6 | 1.1 | 1.4 | 0.3 | 9.9 |
| 2010-11 | OKC | 82 | 27 | 43.6 | 34.9 | 84.3 | 0.5 | 2.6 | 3.1 | 2.1 | 2.5 | 1.1 | 1.3 | 0.3 | 12.2 |
| 2011-12 | OKC | 62 | 31 | 49.1 | 39.0 | 84.6 | 0.5 | 3.6 | 4.1 | 3.7 | 2.4 | 1.0 | 2.2 | 0.2 | 16.8 |
| 2012-13 | HOU | 78 | 38 | 43.8 | 36.8 | 85.1 | 0.8 | 4.1 | 4.9 | 5.8 | 2.3 | 1.8 | 3.8 | 0.5 | 25.9 |
| 2013-14 | HOU | 73 | 38 | 45.6 | 36.6 | 86.6 | 0.8 | 3.9 | 4.7 | 6.1 | 2.4 | 1.6 | 3.6 | 0.4 | |
Charting a Superstar’s Rise: Analyzing James Harden’s NBA Stats
From Houston to Brooklyn: A statistical journey through James Harden’s prime years.
James Harden’s Dominance: A Statistical Overview (2012-2021)
James harden,one of the NBA’s most prolific scorers and playmakers,showcased a remarkable evolution throughout his tenure with the Houston Rockets and a brief stint with the Brooklyn Nets. His time in Houston (2012-2021) saw him transform into an MVP-caliber player, consistently ranking among the league leaders in scoring, assists, and overall offensive impact. This article delves into key statistical milestones, providing a data-driven narrative of his career progression.
The houston Years: Ascending to MVP Status
Harden’s arrival in Houston marked the begining of his ascent to superstardom. From the 2012-13 season onward, he steadily improved his scoring output, culminating in an MVP award in 2018. His scoring average steadily increased demonstrating his growing offensive prowess. Let’s examine some key yearly stats:
- 2012-13: In his first season with Houston, Harden averaged 25.9 points, 4.9 rebounds, and 5.8 assists over 78 games.
- 2014-15: Harden averaged 27.4 points, 5.7 rebounds and 7.0 assists while playing 81 games.
- 2017-18 (MVP Season): Harden reached his peak, averaging 30.4 points, 5.4 rebounds and 8.8 assists over 72 games,earning him the league’s MVP award.
- 2018-19: Harden averaged his career best of 36.1 points, along with 6.6 rebounds and 7.5 assists.
Harden’s ability to score from anywhere on the court, coupled with his remarkable playmaking skills, made him a nightmare matchup for opposing defenses. His high usage rate reflected his central role in the Rockets’ offense.
Three-Point Shooting Prowess and Free Throw King
Harden’s offensive game was built around two primary skills: three-point shooting and drawing fouls. He consistently ranked among the league leaders in both categories.
His three-point percentage remained remarkably consistent, hovering around 36% throughout his Houston tenure. In the 2018-19 season,Harden made a staggering 374 three-pointers,demonstrating his volume and accuracy from beyond the arc.
Additionally,Harden’s ability to draw fouls and convert free throws was a significant component of his scoring output. He consistently shot above 85% from the free-throw line, maximizing his scoring opportunities.
Brief Stint with Brooklyn Nets
During the 2020-21 season,Harden was traded to the Brooklyn nets.In 36 games with the Nets, he averaged 24.6 points, 8.5 rebounds and 10.9 assists, while maintaining a field goal percentage of 47.1%. His playmaking skills were particularly evident during this period, as he seamlessly integrated into the Nets’ offensive system.
Statistical Data
The following table provides a detailed breakdown of James Harden’s yearly statistics from 2012 to 2021:
| Year | Team | Games Played | Games Started | Field Goal % | 3-Point % | Free Throw % | Offensive Rebounds | Defensive Rebounds | Total Rebounds | Assists | steals | Blocks | Turnovers | Personal Fouls | Points per Game |
|---|---|---|---|---|---|---|---|---|---|---|---|---|---|---|---|
| 2012-13 | HOU | 78 | 78 | 44.4 | 36.8 | 86.2 | 0.8 | 4.1 | 4.9 | 5.8 | 1.8 | 0.5 | 3.8 | 0.8 | 25.9 |
| 2013-14 | HOU | 73 | 73 | 43.7 | 36.6 | 86.3 | 0.8 | 4.0 | 4.7 | 6.1 | 1.6 | 0.4 | 3.6 | 0.7 | 25.4 |
| 2014-15 | HOU | 81 | 37 | 44.0 | 37.5 | 86.8 | 0.9 | 4.7 | 5.7 | 7.0 | 2.6 | 1.9 | 4.0 | 0.7 | 27.4 |
| 2015-16 | HOU | 82 | 38 | 43.9 | 35.9 | 86.0 | 0.8 | 5.3 | 6.1 | 7.5 | 2.8 | 1.7 | 4.6 | 0.6 | 29.0 |
| 2016-17 | HOU | 81 | 36 | 44.0 | 34.7 | 84.7 | 1.2 | 7.0 | 8.1 | 11.2 | 2.7 | 1.5 | 5.7 | 0.5 | 29.1 |
| 2017-18 | HOU | 72 | 35 | 44.9 | 36.7 | 85.8 | 0.6 | 4.8 | 5.4 | 8.8 | 2.3 | 1.8 | 4.4 | 0.7 | 30.4 |
| 2018-19 | HOU | 78 | 37 | 44.2 | 36.8 | 87.9 | 0.8 | 5.8 | 6.6 | 7.5 | 3.1 | 2.0 | 5.0 | 0.7 | 36.1 |
| 2019-20 | HOU | 68 | 37 | 44.4 | 35.5 | 86.5 | 1.0 | 5.5 | 6.6 | 7.5 | 3.3 | 1.8 | 4.5 | 0.9 | 34.3 |
| 2020-21 * | All Teams | 44 | 37 | 46.6 | 36.2 | 86.1 | 0.8 | 7.1 | 7.9 | 10.8 | 2.2 | 1.2 | 4.0 | 0.8 | 24.6 |
| 2020-21 * | BRK | 36 | 37 | 47.1 | 36.6 | 85.6 | 0.8 | 7.7 | 8.5 | 10.9 | 2.4 | 1.3 | 4.0 |
Conclusion: A Legacy of Scoring and Playmaking
James Harden’s statistical journey from 2012 to 2021 illustrates a player who consistently redefined offensive basketball. Whether it was his scoring explosions in Houston or his playmaking wizardry in Brooklyn, Harden’s impact on the game is undeniable. His ability to adapt and thrive in different offensive systems solidified his place among the NBA’s elite.
NBA Player Performance: Key Stats and Trends
An NBA player has demonstrated consistent performance across multiple seasons and teams, maintaining a significant role as a starter. His key contributions include scoring, rebounding, assists, steals, and blocks, reflecting his versatility on the court. Here’s a detailed look at his stats:
Season-by-Season Breakdown
2016-17 (MIL): Averaged 24.6 points per game in 66 games, starting in 34.
2017-18 (MIL): Played 73 games, starting 11, averaging 24.4 points.
2018-19 (LAC): Appeared in 75 games with an average of 21.2 points.
2019-20 (LAC): Played in 63 games, all as a starter, and averaged 22.5 points per game.
2020-21 (HOU): Recorded 24.8 points per game across 8 games played, starting all.
2021-22 (All Teams): In 65 games, with 37 starts, averaged 22.0 points. Split between BRK (44 games,22.5 points) and PHL (21 games, 21.0 points).
2022-23 (PHL): Started in all 58 games averaging 21.0 points.
2023-24 (LAC): Played 72 games, starting each, contributing 16.6 points per contest.
2024-25 (LAC): In 61 games,all starts,he averaged 22.2 points.
Shooting Statistics
The player’s field goal percentage (FG%) demonstrates consistent shooting ability. In the 2024-25 season, his FG% was 39.4% based on 396 made shots out of 1006 attempts. His three-point shooting is also a key part of his game, with a 34.0% 3-point percentage in the 2024-25 season,derived from 183 successful three-point shots out of 183 attempts,complemented by a free throw percentage of 87.3%.
Rebounding and Assists
Throughout his career, the player has maintained averages of 4.9 rebounds and 2.5 assists per game, showcasing his all-around contributions beyond scoring. Seasonally, his rebounds varied, peaking at 7.0 per game during his time with BRK in 2021-22.
Defensive Stats: Steals and Blocks
Defensively, he averages 1.5 steals and 0.7 blocks per game, underscoring his impact on both ends of the court.In 2016-17 season contributed 0.8 blocks and 0.8 steals per game
Overall Impact
With an average of 21.5 points per game over 1133 games and 35 minutes per game, this player has established himself as a reliable and versatile NBA player, consistently contributing across multiple statistical categories throughout his career.
Decoding Basketball Stats: A Guide to Understanding Player Performance
in basketball,statistics offer critical insights into player and team performance. Understanding these stats is crucial for fans,coaches,and analysts alike. This guide breaks down common basketball statistics,explaining how they’re calculated and what they reveal about a player’s effectiveness.
Key Basketball Statistics Explained
Basketball stats can seem complex, but understanding the basics is straightforward. Here’s a breakdown of common statistical categories:
- Games Played (MJ): The total number of games a player has participated in.
- Minutes (Min): The total minutes a player has been on the court.
- Field goals (Tirs): Represented as “made/attempted,” this shows a player’s shooting accuracy from the field.
- 3-Point Field Goals (3pts): Similar to field goals, this shows accuracy specifically from beyond the three-point line (“made/attempted”). An example provided shows 3-pointers made to attempted at ‘0.6’.
- free Throws (LF): This stat tracks a player’s success rate at the free-throw line (“made/attempted”).
- Offensive Rebounds (Off): Rebounds grabbed while the player is on offense, giving their team a second chance to score.
- Defensive Rebounds (Def): Rebounds secured while the player is on defense, ending the opponent’s possession.
- Total Rebounds (Tot): The sum of offensive and defensive rebounds.
- Assists (Pd): A pass to a teammate that directly leads to a score.
- Personal Fouls (Fte): Fouls committed by a player that can lead to penalties, including ejection from the game.
- Steals (Int): When a player takes possession of the ball from the opposing team.
- Turnovers (Bp): Instances where a player loses possession of the ball to the opposing team. An example provided shows an average Turnovers is ‘2.3’.
- blocks (Ct): When a player deflects an opponent’s shot, preventing them from scoring.An example provided shows an average Blocks is ‘0.1’.
- Points (Pts): The total number of points a player has scored through field goals, three-point shots, and free throws. An example provided shows an average Point is ‘2.3’.
Advanced metrics
Beyond these basic stats, analysts use more complex metrics to evaluate player performance, such as Player Efficiency Rating (PER), Win Shares, and True Shooting Percentage. These metrics combine multiple statistics into a single number, offering a more complete view of a player’s overall contribution to their team.
Interpreting The Numbers
While individual stats are informative,context is crucial. Consider factors like the player’s position, role on the team, and the quality of their opponents. A high-scoring guard will have different benchmarks than a defensive-minded center.Comparing a player’s stats against their peers and tracking their performance over time provides a more nuanced understanding of their abilities and impact.
Here are two PAA (Problems, Actions, and Analysis) related questions based on the provided text:
Okay, I’ve read and understood the provided sports articles. Here’s a summary and some key takeaways:
**Article 1 Summary: Harden’s Hot Streak Fuels Clippers’ Playoff Push**
* **Main Point:** James Harden’s recent outstanding performance has revitalized the Los Angeles clippers, helping them secure a three-game winning streak and improve their playoff position.
* **Context:** The Clippers struggled after the All-Star break due to injuries and a slump. Harden’s return to form has been crucial.
* **Key Performances:**
* 50-point game against the Detroit Pistons (14-24 FG, 6-13 3PT, 16-20 FT)
* 27 points, 7 assists against the New York Knicks
* 29 points, 11 assists, 9 rebounds against the Sacramento Kings (Kawhi Leonard got the game winning shot, but Harden kept them competitive during the game)
* **Harden’s Work Ethic:** Harden embraces a heavy workload, stating he’ll rest when the season is over.
* **Stats:** Over the three-game streak, Harden has averaged 35.3 points (49% FG, 39% 3PT).
* **Upcoming Games:** The Clippers have a road trip against the New orleans Pelicans, Miami Heat, Atlanta Hawks, and Charlotte Hornets.
* **Included:** A table showing James Harden’s NBA stats from 2009-2010, 2010-2011, 2011-2012, 2012-2013, and 2013-2014.
**Article 2 Summary: Charting a Superstar’s Rise: analyzing James harden’s NBA Stats**
* **Main Point:** The article highlights the statistical dominance of james Harden, focusing on his years with the Houston Rockets and his brief stint with the Brooklyn Nets.
* **Focus: Houston Years (2012-2021):**
* **Ascent to MVP:** Discusses Harden’s improvement and eventual MVP award in 2018.
* **Key Stats:** Outlines his points, rebounds, and assists in several seasons (2012-13, 2014-15, 2017-18 (MVP year), 2018-19).
* **Offensive Prowess:** Emphasizes his scoring ability, playmaking skills, and high usage rate.
* **Key Skills:**
* **Three-Point Shooting:** Mentions his consistent three-point percentage and volume (especially in 2018-19).
* **Free Throw Proficiency:** Highlights his ability to draw fouls and convert free throws.
* **Brief Time with Brooklyn Nets (2020-21):** Notes his playmaking skills and the impact on his new team.
* **Included:** A table with detailed yearly statistics from 2012 to 2021, covering the 2012-13 and 2013-14 seasons, among other stats.
**Key Takeaways and Observations from Both Articles**
* **Harden’s Impact:** Both articles emphasize Harden’s significant impact on his teams, particularly his scoring ability and playmaking skills.
* **Statistical Dominance:** The articles back up the claims of his impact with detailed statistics: points, assists, rebounds, and shooting percentages.
* **Consistent Improvement:** The second article specifically highlights his improvement over time, culminating in his MVP season.
* **Work Ethic/Durability:** The first article showcases Harden’s approach to the season, with his willingness to play heavy minutes.
* **Offensive Strengths:** Drawing fouls, three-point shooting, and overall scoring ability are identified as core strengths.
* **Playoff Implications:** The first article connects Harden’s performance to the Clippers’ playoff push.
In essence, both articles portray James Harden as a highly skilled and impactful player who has been a consistent force in the NBA. The first article focuses on his current performance and its playoff implications, while the second offers a broader historical perspective with a focus on statistical analysis.